TTS Spectrogram Generator

DLC86

Roadie
Messages
732

TTS Spectrogram Generator v1.0​


For anyone who wants to test aliasing, I created (with the help of DeepSeek and ChatGPT) this html page to generate spectrograms: https://drive.google.com/drive/folders/1HJyhP9YWJMq7t7coCwXSCqMe83FpGHKm?usp=sharing

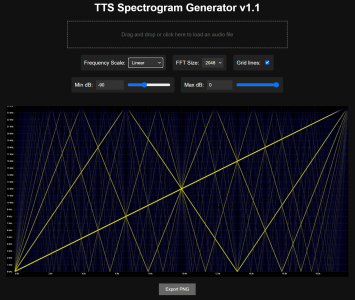
Here's how it currently looks:
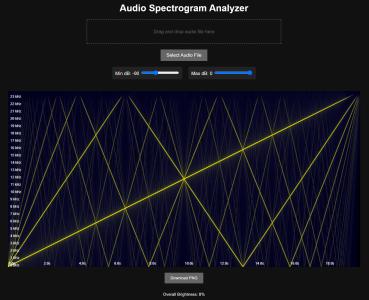
TTS Spectrogram Generator v1.0 example.png

Here are the instructions on how to use it to produce graphs like the one you see in the image:
  • generate, using the free software REW (roomeqwizard.com) or any other similar tool, a linear sine sweep (I suggest at least 10 second long) going from 0 Hz to 24 kHz.
  • reamp it thru the gear or plugin you want to test
  • open the provided html file in any browser and load the file
At this point the graph will be visualized and can also be downloaded as a PNG file. There are also two sliders that allow you to change the minimum and maximum threshold.
A few tips:

  • always use the same level for the sweep if you want to compare different graphs
  • try to match the gain if you want to compare different plugins/gear
  • by using the min threshold slider you can identify the level of each line in the graph simply by moving the slider and seeing at what value the line disappears
  • The maximum possible value of in the min threshold slider is -40 dB, this is considered the threshold of audibility so, if you don't see any aliasing at this level, it means that the model/plugin/gear is good enough

N.B.: there are still some issues on the graph that I need to fix (like banding and leakage into adjacent frequencies into each bin), but I think it's already good enough to be used. A new version will be released once I fix these issues and make a few tweaks to the interface.
 

TTS Spectrogram Generator v1.1​

New release: https://drive.google.com/.../1HJyhP9YWJMq7t7coCwXSCqMe83F...

Screenshot 2025-02-11 232840.png

Changelog:
  • Fixed the "banding" issue by using Blackman window and tweaking overlap between bins
  • Improved the sliders' performance by making them redraw the graph only once the user releases the mouse button after moving them
  • Added ability to type in specific dB values via keyboard for min and max thresholds
  • Added Frequency scale selector: you can now choose between linear and logarithmic. Default setting is linear
  • Added FFT sample size selector: you can now choose between 1024, 2048, 4096 and 8192 samples. Default value is 2048, in the previous version it was set to 4096
  • Added grid lines overlay: this shows some dashed lines on top of the graph, corresponding to time and frequency scales steps
  • The exported PNG file now has the same name as the audio file, plus indication of threshold values between square brackets
  • Increased the native resolution of the graph, it is 2000x1000 now and the PNG is exported at the same resolution
  • Removed the "load audio file" button: the drag and drop area is now also clickable to open the file explorer and import the file
  • Removed the brightness indicator as it is pretty much useless for our goals and it was making the graph processing unnecessarily heavier

Let me know if you encounter bugs or if you have ideas for improvements and new features
 
Looks nice. Thanks for providing this resource. I was wondering how the anti aliasing graphs were generated.
I was previously using Spectralayers in Cubase to make them, but since a lot of people asked me about this and there were no comparable free alternatives, I decided to make and share this script.

Nice work and clean looking code!
Thanks but that's mostly DeepSeek's and ChatGPT's merit, I just guided them into making the correct features and fixes, I only manually edited basic stuff about the UI and graph parameters.
Their DeepThink and Reasoning modes are mindblowing for this kind of stuff btw, it's like having a very good programmer (but with ADHD!) at your disposal. This opens up a lot of possibilities for someone like me who has very basic programming skills, I wonder how it will perform once I use it for some more complicated ideas I have in mind.
 
Last edited:
I was previously using Spectralayers in Cubase to make them, but since a lot of people asked me about this and there were no comparable free alternatives, I decided to make and share this script.


Thanks but that's mostly DeepSeek's and ChatGPT's merit, I just guided them into making the correct features and fixes, I only manually edited basic stuff about the UI and graph parameters.
Their DeepThink and Reasoning modes are mindblowing for this kind of stuff btw, it's like having a very good programmer (but with ADHD!) at your disposal. This opens up a lot of possibilities for someone like me who has very basic programming skills, I wonder how it will perform once I use it for some more complicated ideas I have in mind.
That is actually pretty impressive. All I've been able to get out of ChatGPT is code that then reasons itself into increasingly incorrect stuff.
 
That is actually pretty impressive. All I've been able to get out of ChatGPT is code that then reasons itself into increasingly incorrect stuff.
Yeah that's what happens with standard ChatGPT and I got quite frustrated on the first tries with that. Then I discovered I should have pressed the "Reason" and "Search" buttons below the chat (or the equivalents on deepseek), those make it much more reliable, it often made the right decisions on first try and it also shows its "thought process" to generate the answer, from which you can learn a lot.
The only problem is that ChatGPT asks you to pay after using it for a while or to wait a few hours. And DeepSeek often doesn't respond cuz its servers are busy.
 
Last edited:
Oh btw, a new version is out

TTS Spectrogram Generator v1.2​


Changelog:
  • Fixed an error showing up in the browser console regarding AudioContext, this process now correctly starts after the first user input to comply with modern browsers' requirements. This might prevent malfunctioning of the script in some browsers
 
Last edited:

TTS Spectrogram Generator v1.4​


Changelog:
  • The script is now compatible with iOS and Android browsers and has a UI optimized for mobile usage that automatically activates when a mobile browser is detected
  • Double-clicking on sliders (or double-tapping on touchscreens) resets their values to default
  • The tool is now also available online on my website: https://shop.thetonescientist.com/pages/audio-tools
 

TTS Spectrogram Generator v1.5​


Changelog:
  • Fixed wrong dB-to-brightness mapping calculation: previously final values after FFT were wrong and went above 0 dBFS, this resulted in brighter than normal graphs and "clipping"
  • Added Normalize switch: by setting it to "off" the graph shows brightness and colours based on original dBFS readings from the audio file. By setting it to "on" instead (which is the new default) the graph is normalized so that the highest peak in the audio is shown as if it was at 0 dB. This is useful to make comparisons between files with different peak levels easier and more fair
  • Added Color selector: you can now choose to render the graph with several different color schemes, both gradients and single color
  • Added dialog box to customize the filename of the exported PNG (by default it still matches the name of the audio file)
  • Added info about the script version, the filename and the parameters' values used above the graph, which are also rendered in the exported PNG. To account for the space used by this, the native resolution of canvas and exported image is now 2160x1080
  • Added an overlay that shows the text "Processing..." while the graph is being generated or refreshed. This also prevents additional parameter changes during the processing to improve stability and performance.
  • Several fixes and improvements in the logic of controls and UI to improve reliability, stability and performance and to avoid unnecessary and redundant graph redraws.

Online version: https://shop.thetonescientist.com/pages/audio-tools
Html file download: https://drive.google.com/drive/folders/1HJyhP9YWJMq7t7coCwXSCqMe83FpGHKm?usp=drive_link
 
Last edited:

TTS Spectrogram Generator v2.0​

Changelog:
  • Revamped the UI.
  • Added support for .aac, .alac, .flac and .mp3 files, this requires internet connection as it relies on an external library (aurora.js) and codecs, if you want to use the script offline you can change it to point to local *.js files instead.
  • Added support for all common sample rates and bit depths.
  • Added controls for Frequency Range and Time Range min and max values, these allow to "zoom" into the spectrogram and see only the range of interest. Max frequency defaults to Nyquist and max time defaults to file length.
  • Added settings button for the PNG export, this lets you choose parameters to include in the filename of the .png image.
  • Amplitude-to-color/brightness mapping now uses a log factor that better matches color and brightness to auditory human perception. This produces slightly brighter image for signals in the middle of the selected Amplitude Range.
  • Added a bar on the right of the graph to show an example of the gradient used for the current color. This also has a scale that indicates what dBFS value roughly corresponds to a certain color/brightness for the selected amplitude range, with tick marks displayed every 6dB.
  • Removed dB range indication from the image footer cuz it's now redundant due to the gradient bar addition.
  • Removed sliders cuz they were a nightmare to debug and maintain, and probably not that useful since the graph isn't refreshed in real-time.
  • Several other minor fixes and improvements.

Online version: https://shop.thetonescientist.com/pages/audio-tools
Html file download: https://drive.google.com/drive/folders/1HJyhP9YWJMq7t7coCwXSCqMe83FpGHKm?usp=drive_link
 
I finally got to play with this tool. The online version is so easy to use. I didn’t think it was going to pretty much instantaneously generate an image.

I don’t want to stir the NAM issues, but I think I’ll find this helpful for my personal experiments with the newer developments.
 
Out of my depth here, but can you feed the sweep file into you modeler - record it as a .WAV - and then get the aliasing analysis -or- does it have to be done in live-in-real-time ?
 
Out of my depth here, but can you feed the sweep file into you modeler - record it as a .WAV - and then get the aliasing analysis -or- does it have to be done in live-in-real-time ?
I haven’t tried with a modeler, but the idea is what you described in the first case. Record the wet output as a WAV, drop the WAV into the webpage he made, and a graph comes up.
 
Yep, it only works with audio files, no real time processing. Just reamp a 20 seconds 0-24kHz linear sine sweep thru what you want to test, you can generate the sine sweep file via the Generator in REW or at this link: https://www.audiocheck.net/audiofrequencysignalgenerator_sweep.php

Thanks ! :)

Having trouble getting the generator to create a sweep ? What settings do you put in each of these " Value" boxes ? Im trying 0, 24000, -3, 10, 48k and it wont process and gives an error ?

1739964255762.png
 
This combo doesn't work.

View attachment 39228

The Error:-

View attachment 39229

Any ideas ?
Sorry, didn't see your first post for some reason... it doesn't accept 24000, you need to put 23999.9999 there. And the same for the start frequency iirc (0.0001 instead of 0).

Also, I suggest setting the duration to 20s at least, to have better resolution on the spectrogram, and level to 0 (you can turn it down later on if needed)
 
Back
Top