I've downloaded the IRs and have begun examining them. As before, I've only looked at the greenback.
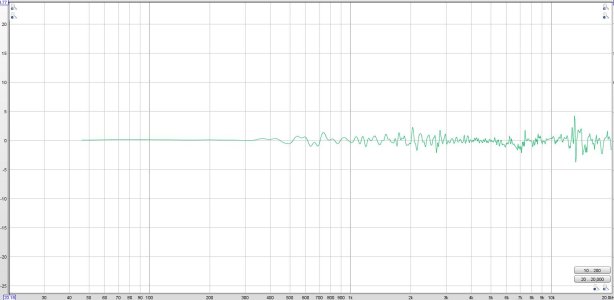
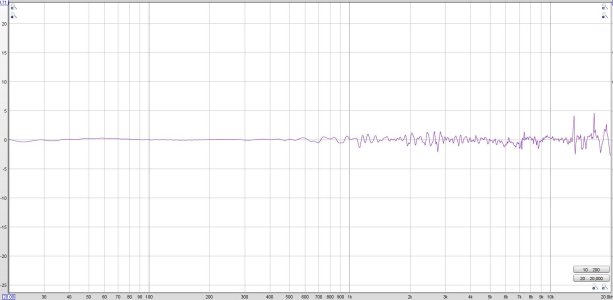
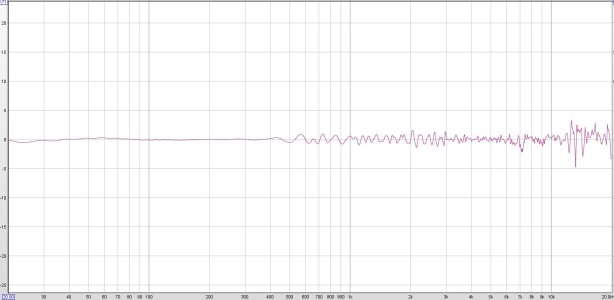
The first set of graphs comes from normalizing the 0.00 files to the "D" one. If the placement of the microphone and the speaker are not altered at all from one test to another - IOW, if the speaker is rotated in the enclosure without altering the position of its center and the mic is placed at exactly the same locations for each orientation of the speaker - then all of these normalized charts will lie within your test repeatibility window at all frequencies.
Edit: because these IRs were all ostensibly taken
on axis, they should be
identical. Cylindrical asymmetry will have no effect on them. I use the same set of tests, in addition to a few others, to verify the calibration of my rotational fixture and mic placement when I'm acquiring directional data on loudspeakers.
Here they are:
Left normalized to down:

Right normalized to down:

Up normalized to down:

Note that there are significant deviations. The fact that they are there casts doubt on the accuracy of speaker placement after rotations and/or mic positioning. Note that 2.5mm is a small increment - .098 inches. If this is enough to lead to audible differences in IRs from adjacent positions, it stands to reason that very small errors in mic positioning can also cause deviations.
Possible causes for the above differences:
1. Basic repeatability of the test technique.
2. Small errors in speaker location when it is rotated. There is almost always some play in the fasteners, so you really need to make reference marks to line up with when you remove and reinstall the speaker.
3. Torque variations when you tighten fasteners. This is potentially quite significant with stamped-basket transducers.
4. Small errors in mic placement relative to the cab - including spacing off the grille.
Nothing you have done so far supports your hypothesis that cylindrical asymmetries in the speaker's cone cause audible differences at different rotational angles. If you really believe that this is the case, there is a way to establish that with a high degree of confidence using your present methodology:
1. Do the repeatibility exercise I outlined earlier in the thread. Establish reliable limits on the repeatability of your tests. For example, if the differences in the graphs above were due to repeatibility alone, your repeatibility below 10kHz is roughly +/- 2.5dB and +/- 4.5dB from 10k-20k.
2. Mark your cab so you can reliably reposition the speaker when you rotate it.
3. Establish a method to place the mic relative to the cab with 10% error (.25mm) or less.
4. Use a torque wrench to tighten the fasteners.
5. Re-acquire the "0.00" IRs at D,L,R, and U rotations.
6. Verify that the differences you see fall within your repeatability limits.
7. Re-acquire IRs at a single mic position, carefully observing all the above. Differences you see that lie outside the repeatability limits are due to some kind of cylindrical asymmetry. That is still not necessarily the cone construction, but that's one possibility.


